
Healthcare Is Supporting A Fragile Job Market
The US economy shed 92,000 jobs in February, the worst monthly print in four months and a miss against consensus expectations of +59,000. A downward revision turned December’s gain into a loss. The three-month average is +6,000 per month.
The labor market has been deteriorating for two years without triggering any of the standard recession indicators. The Iran conflict sent oil prices to $119 on Monday before pulling back to the low $90s on Tuesday as signals of a potential de-escalation emerged, but even at current levels, Brent remains roughly 40% above its pre-conflict price. That has narrowed the Fed’s room to cut rates in response to weakening employment.
Strip out healthcare, the only sector consistently creating jobs at scale, and nonfarm payrolls peaked in December 2024. They have declined by 634,000 since, fourteen months of contraction in the broadest measure of non-healthcare employment.
February’s numbers
The February Employment Situation report showed total nonfarm payrolls declining by 92,000, with private payrolls down 86,000 and government shedding 6,000. The unemployment rate rose to 4.4%. Average hourly earnings rose 0.4% month-over-month and 3.8% year-over-year, even as employment contracted. This is consistent with the “tenure dividend” thesis: as firms reduce headcount, they retain a more experienced and higher-paid workforce, which mechanically boosts average earnings while aggregate labor income deteriorates.
The household survey reinforced the establishment data. Total employment fell 185,000. Average unemployment duration climbed to 25.7 weeks, the longest since December 2021. Long-term unemployed reached 1.9 million, up from 1.5 million a year ago.
Roughly 31,000 of February’s losses came from a Kaiser Permanente strike that pulled workers off payrolls during the survey reference week. The strike ended February 23 and will reverse in March data. Adjust for it and February payrolls were still -61,000.
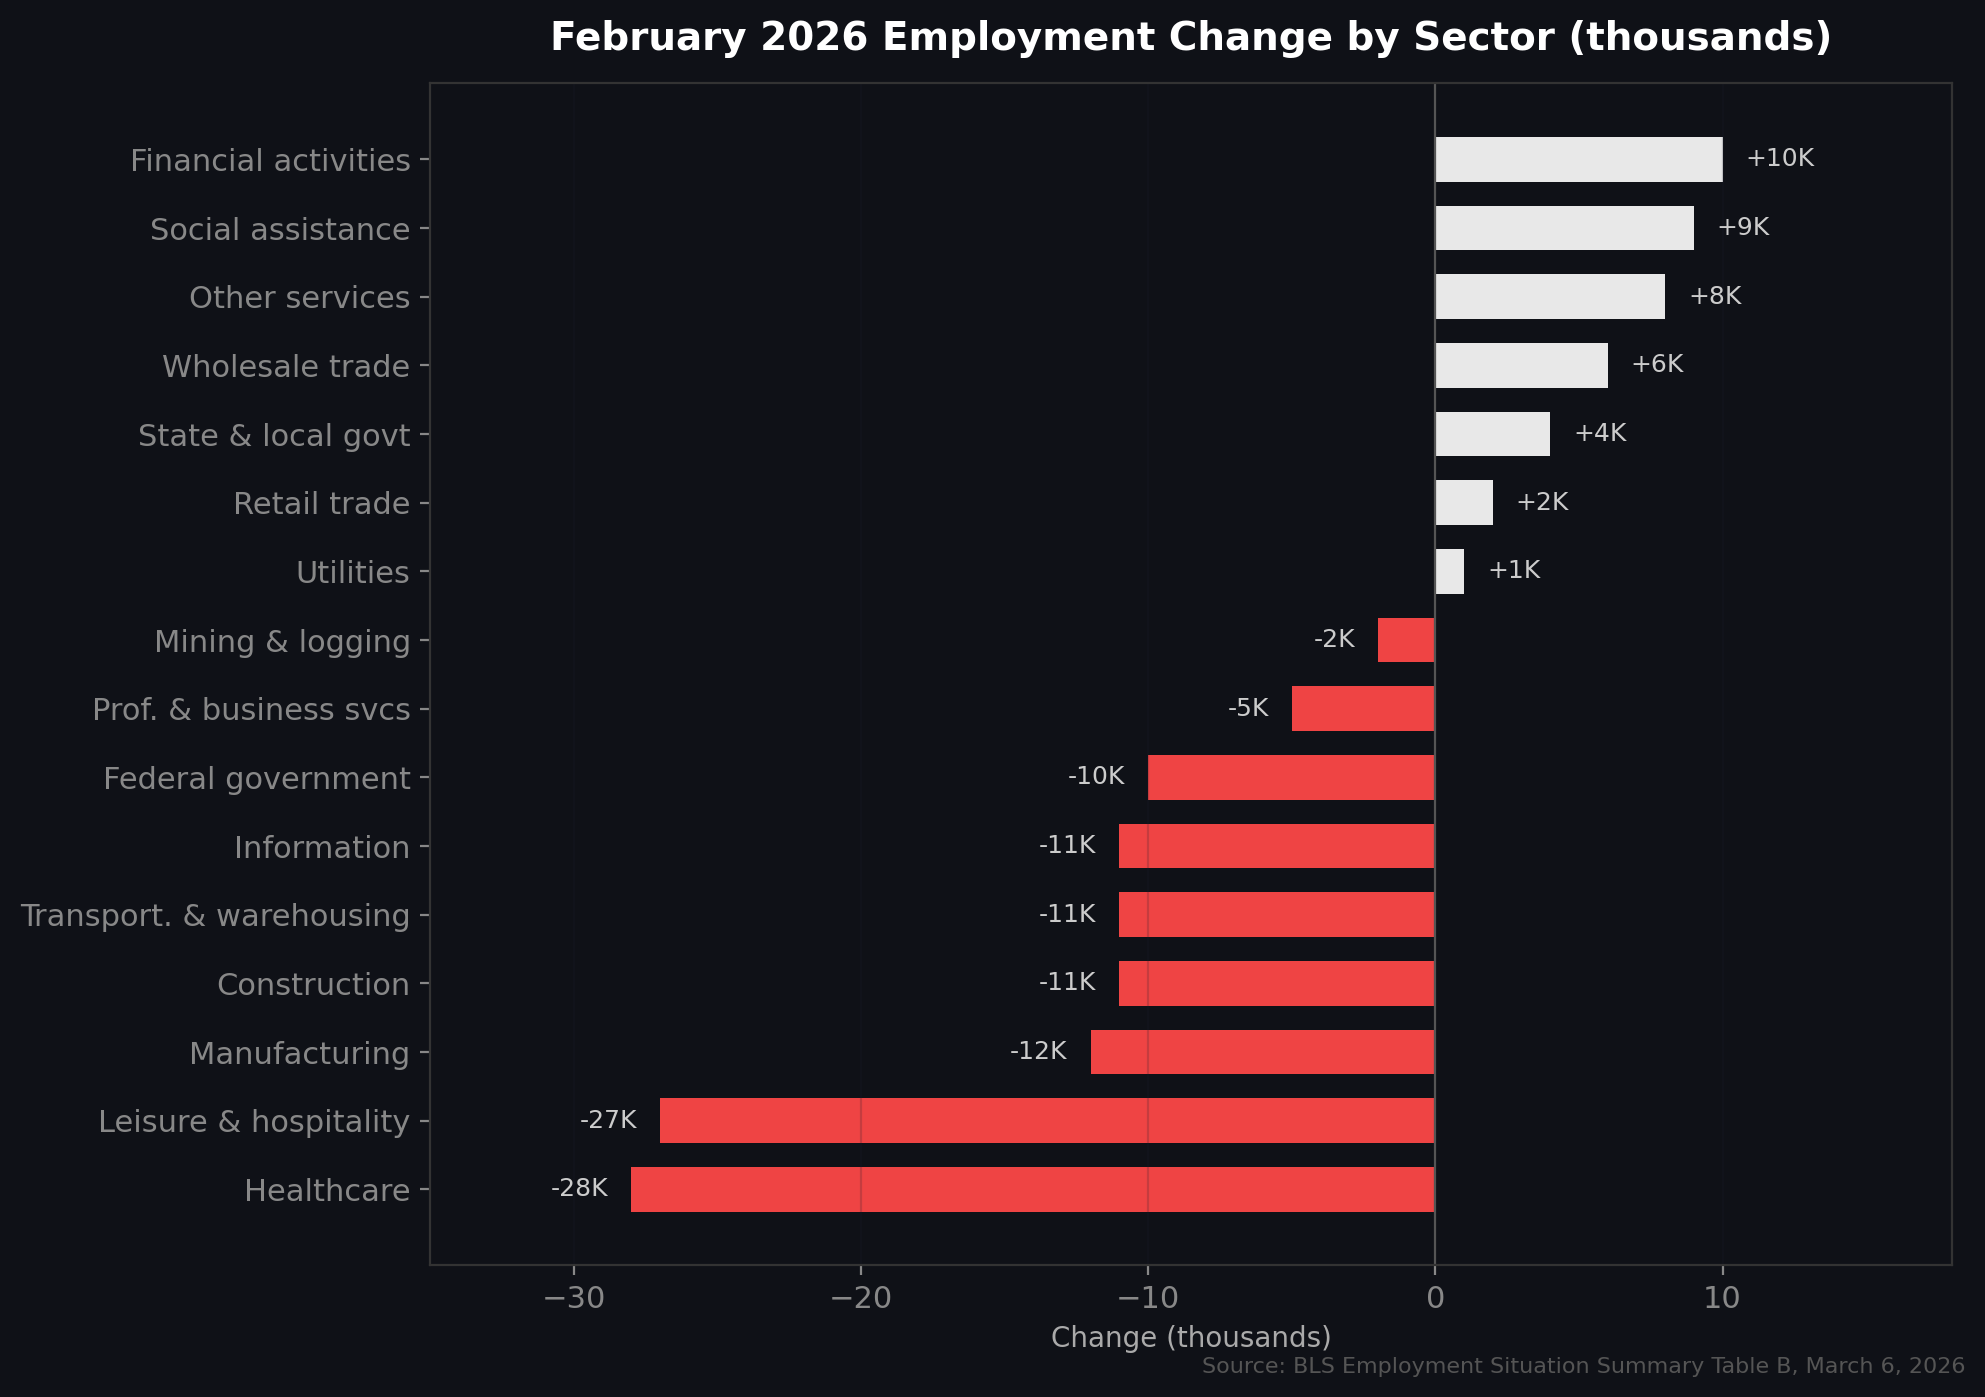
Losses were broad. Leisure and hospitality fell 27,000, manufacturing 12,000, construction 11,000, transportation and warehousing 11,300, information 11,000, and federal government 10,000. The gains were financial activities (+10,000), social assistance (+9,000), and wholesale trade (+6,000). As Omair Sharif of Inflation Insights told Bloomberg, the labor market “is so soft that it cannot withstand a strike of 31,000 physicians in health care because no one else is hiring.”
The BLS also released its 2025 benchmark revision. Total 2025 nonfarm employment growth was revised from +584,000 to +181,000, an average of 15,000 jobs per month, down from the previously reported 49,000. That makes 2025 the slowest year of job growth outside a recession since 2003. Private education and health services accounted for 709,000 jobs in 2025, meaning every other sector combined was negative.
Healthcare’s dominance of job creation is real. Ambulatory care services (especially home health and outpatient clinics) accounted for the largest share of gains, followed by hospitals and nursing facilities. The sector added 693,000 jobs in 2025 and averaged 36,000 per month over the prior twelve months. The recent deceleration in healthcare hiring, including the 10.8% drop in openings in late 2025, is primarily a supply constraint: HRSA projects shortages across nursing, primary care, and allied health through 2038, and the AHA’s 2026 Workforce Scan describes a system where demand from an aging population continues to outpace the pipeline of available workers.
What the headline number does not show
Outside healthcare, employment has been shrinking for over a year.
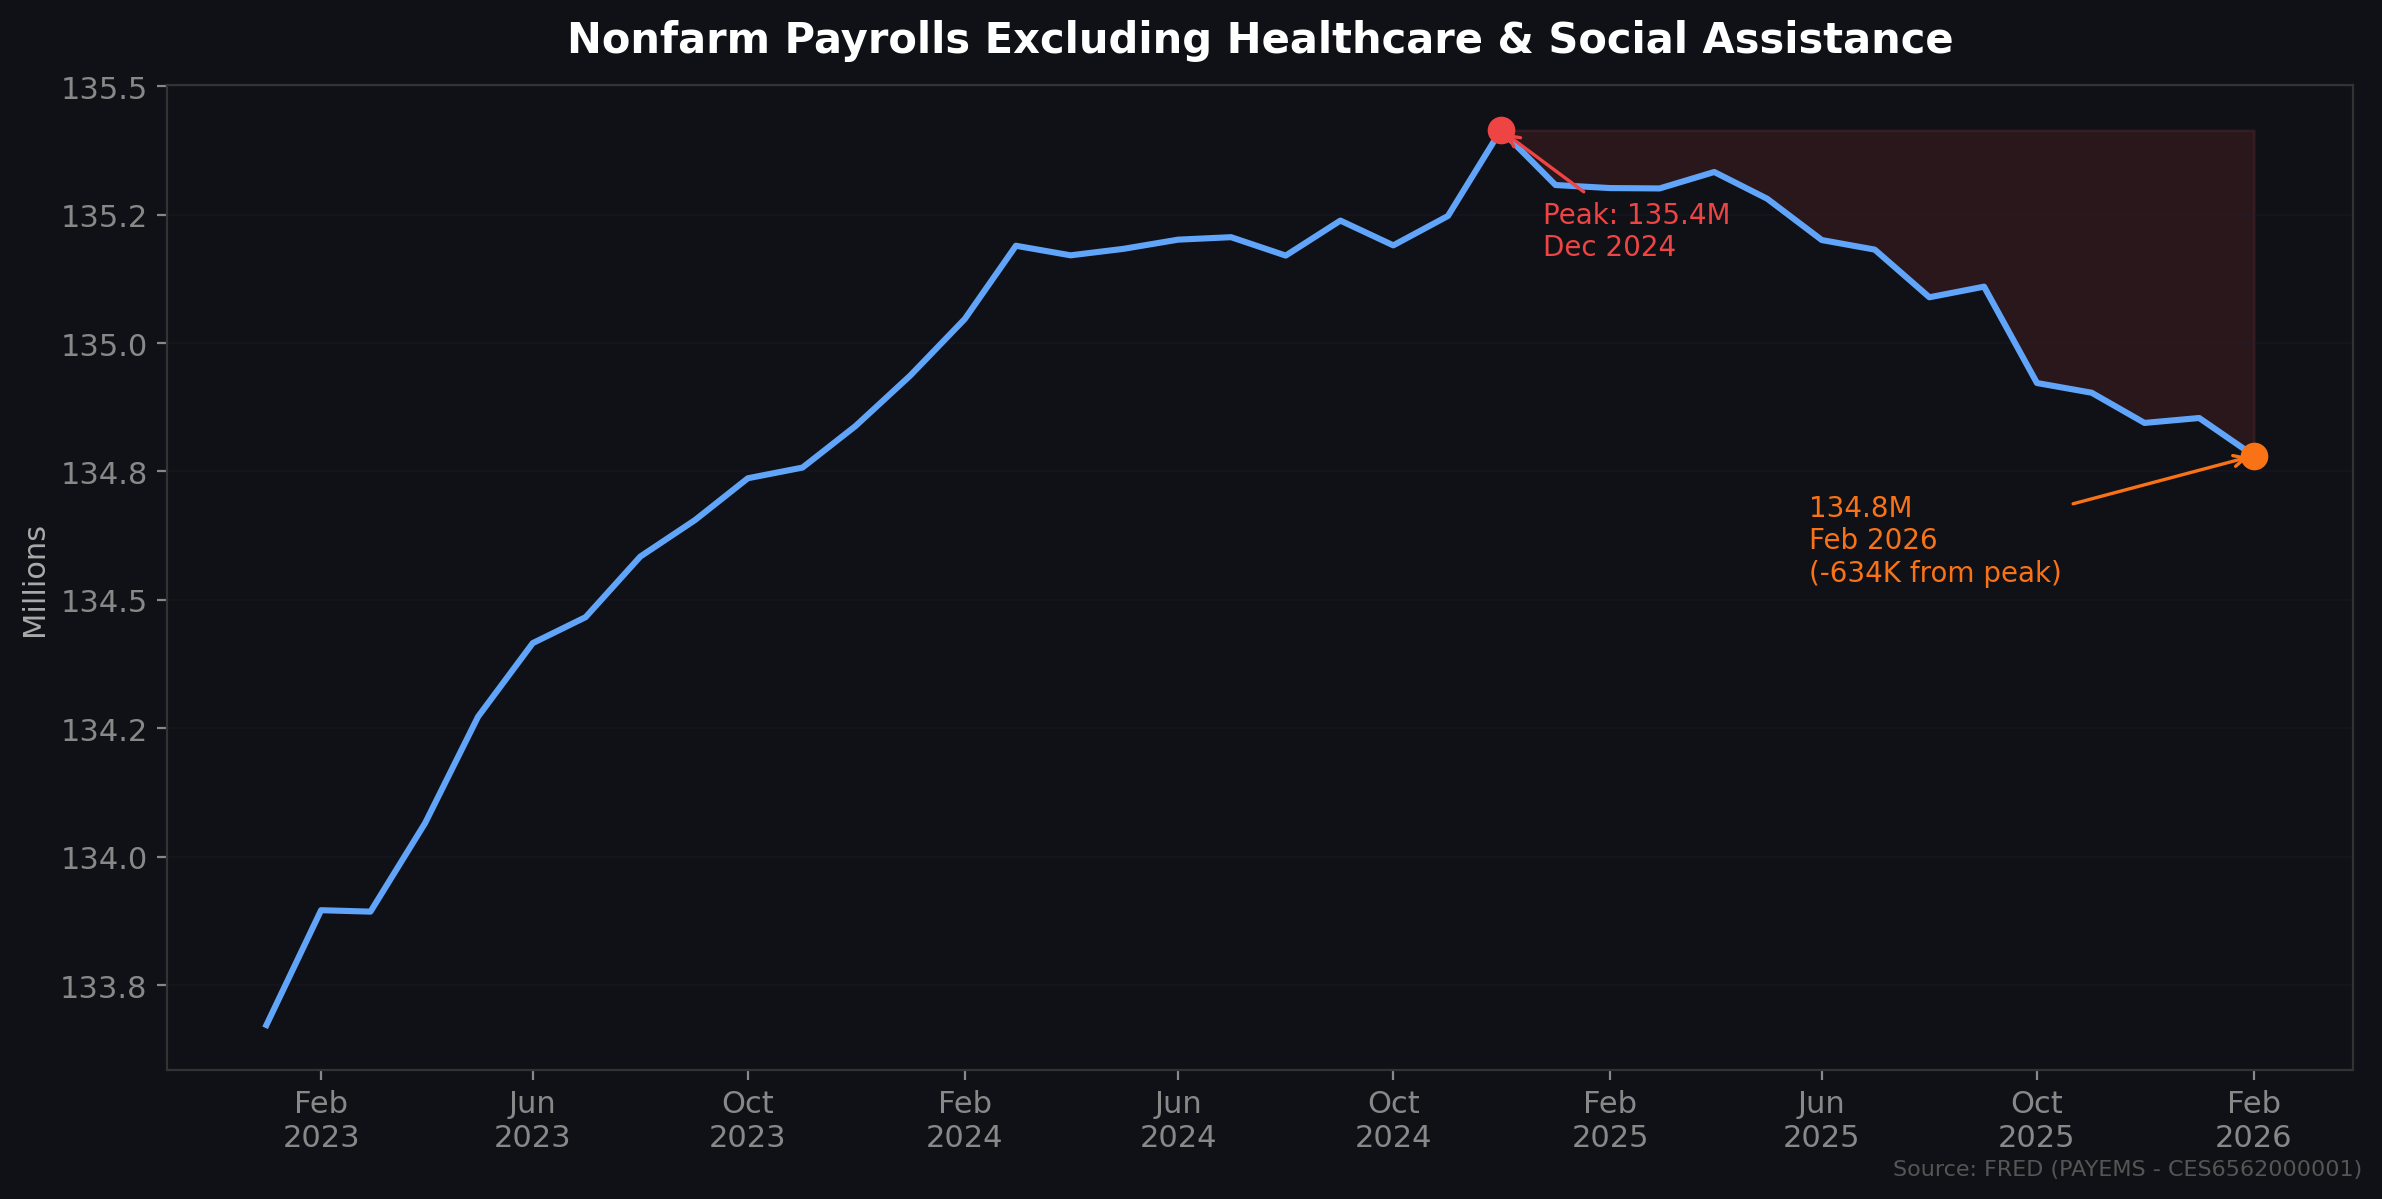
Year-over-year growth crossed zero in June 2025, eight months before the headline total NFP measure followed. This is consistent with prior cycles: in 2001, ex-healthcare growth turned negative two months before the NBER recession start; in 2008, it crossed zero three months after the recession technically began. When a single sector (driven by demographic demand for an aging population, not cyclical strength) accounts for all job creation, the headline payroll number and the underlying state of the labor market are measuring different things.
The breadth of job creation has also narrowed to near zero. The BLS publishes a diffusion index across 250 private industries, where a reading above 50 means more industries are adding jobs than shedding them. February’s reading was 50.8. December was 49.6, meaning more industries contracted than expanded. Manufacturing has been below 50 for four consecutive months.
A headline payroll number of zero can mean every industry is flat, or it can mean healthcare adds 100,000 while everything else loses 100,000. The current composition is closer to the second.
The labor market’s plumbing is deteriorating too. The December JOLTS report showed job openings falling to 6.542 million, the lowest since April 2020. The ratio of openings to unemployed dropped to 0.87, meaning roughly one million more unemployed Americans than available positions. That is the lowest reading since February 2021. The quits rate remained at 2.0%, below its 2019 average. The largest declines in openings came in professional and business services (-257,000), retail (-195,000), and finance (-120,000). Healthcare openings fell 10.8% in the last two months of 2025.
Federal employment has fallen an estimated 330,000 from its October 2024 peak, the largest peacetime reduction in decades. Temporary help services, at 2.48 million, are down 22% from their 2022 peak; after tentative recovery in late 2025, they fell again in February. J.P. Morgan’s Michael Feroli has noted that breakeven payrolls have dropped to roughly 15,000 per month due to reduced immigration. The three-month average is +6,000.
The “low-hire, low-fire” dynamic has defined this labor market since mid-2024. As Indeed Hiring Lab framed it: the question is whether this represents balance or a breaking point.
Why the standard recession indicators haven’t triggered
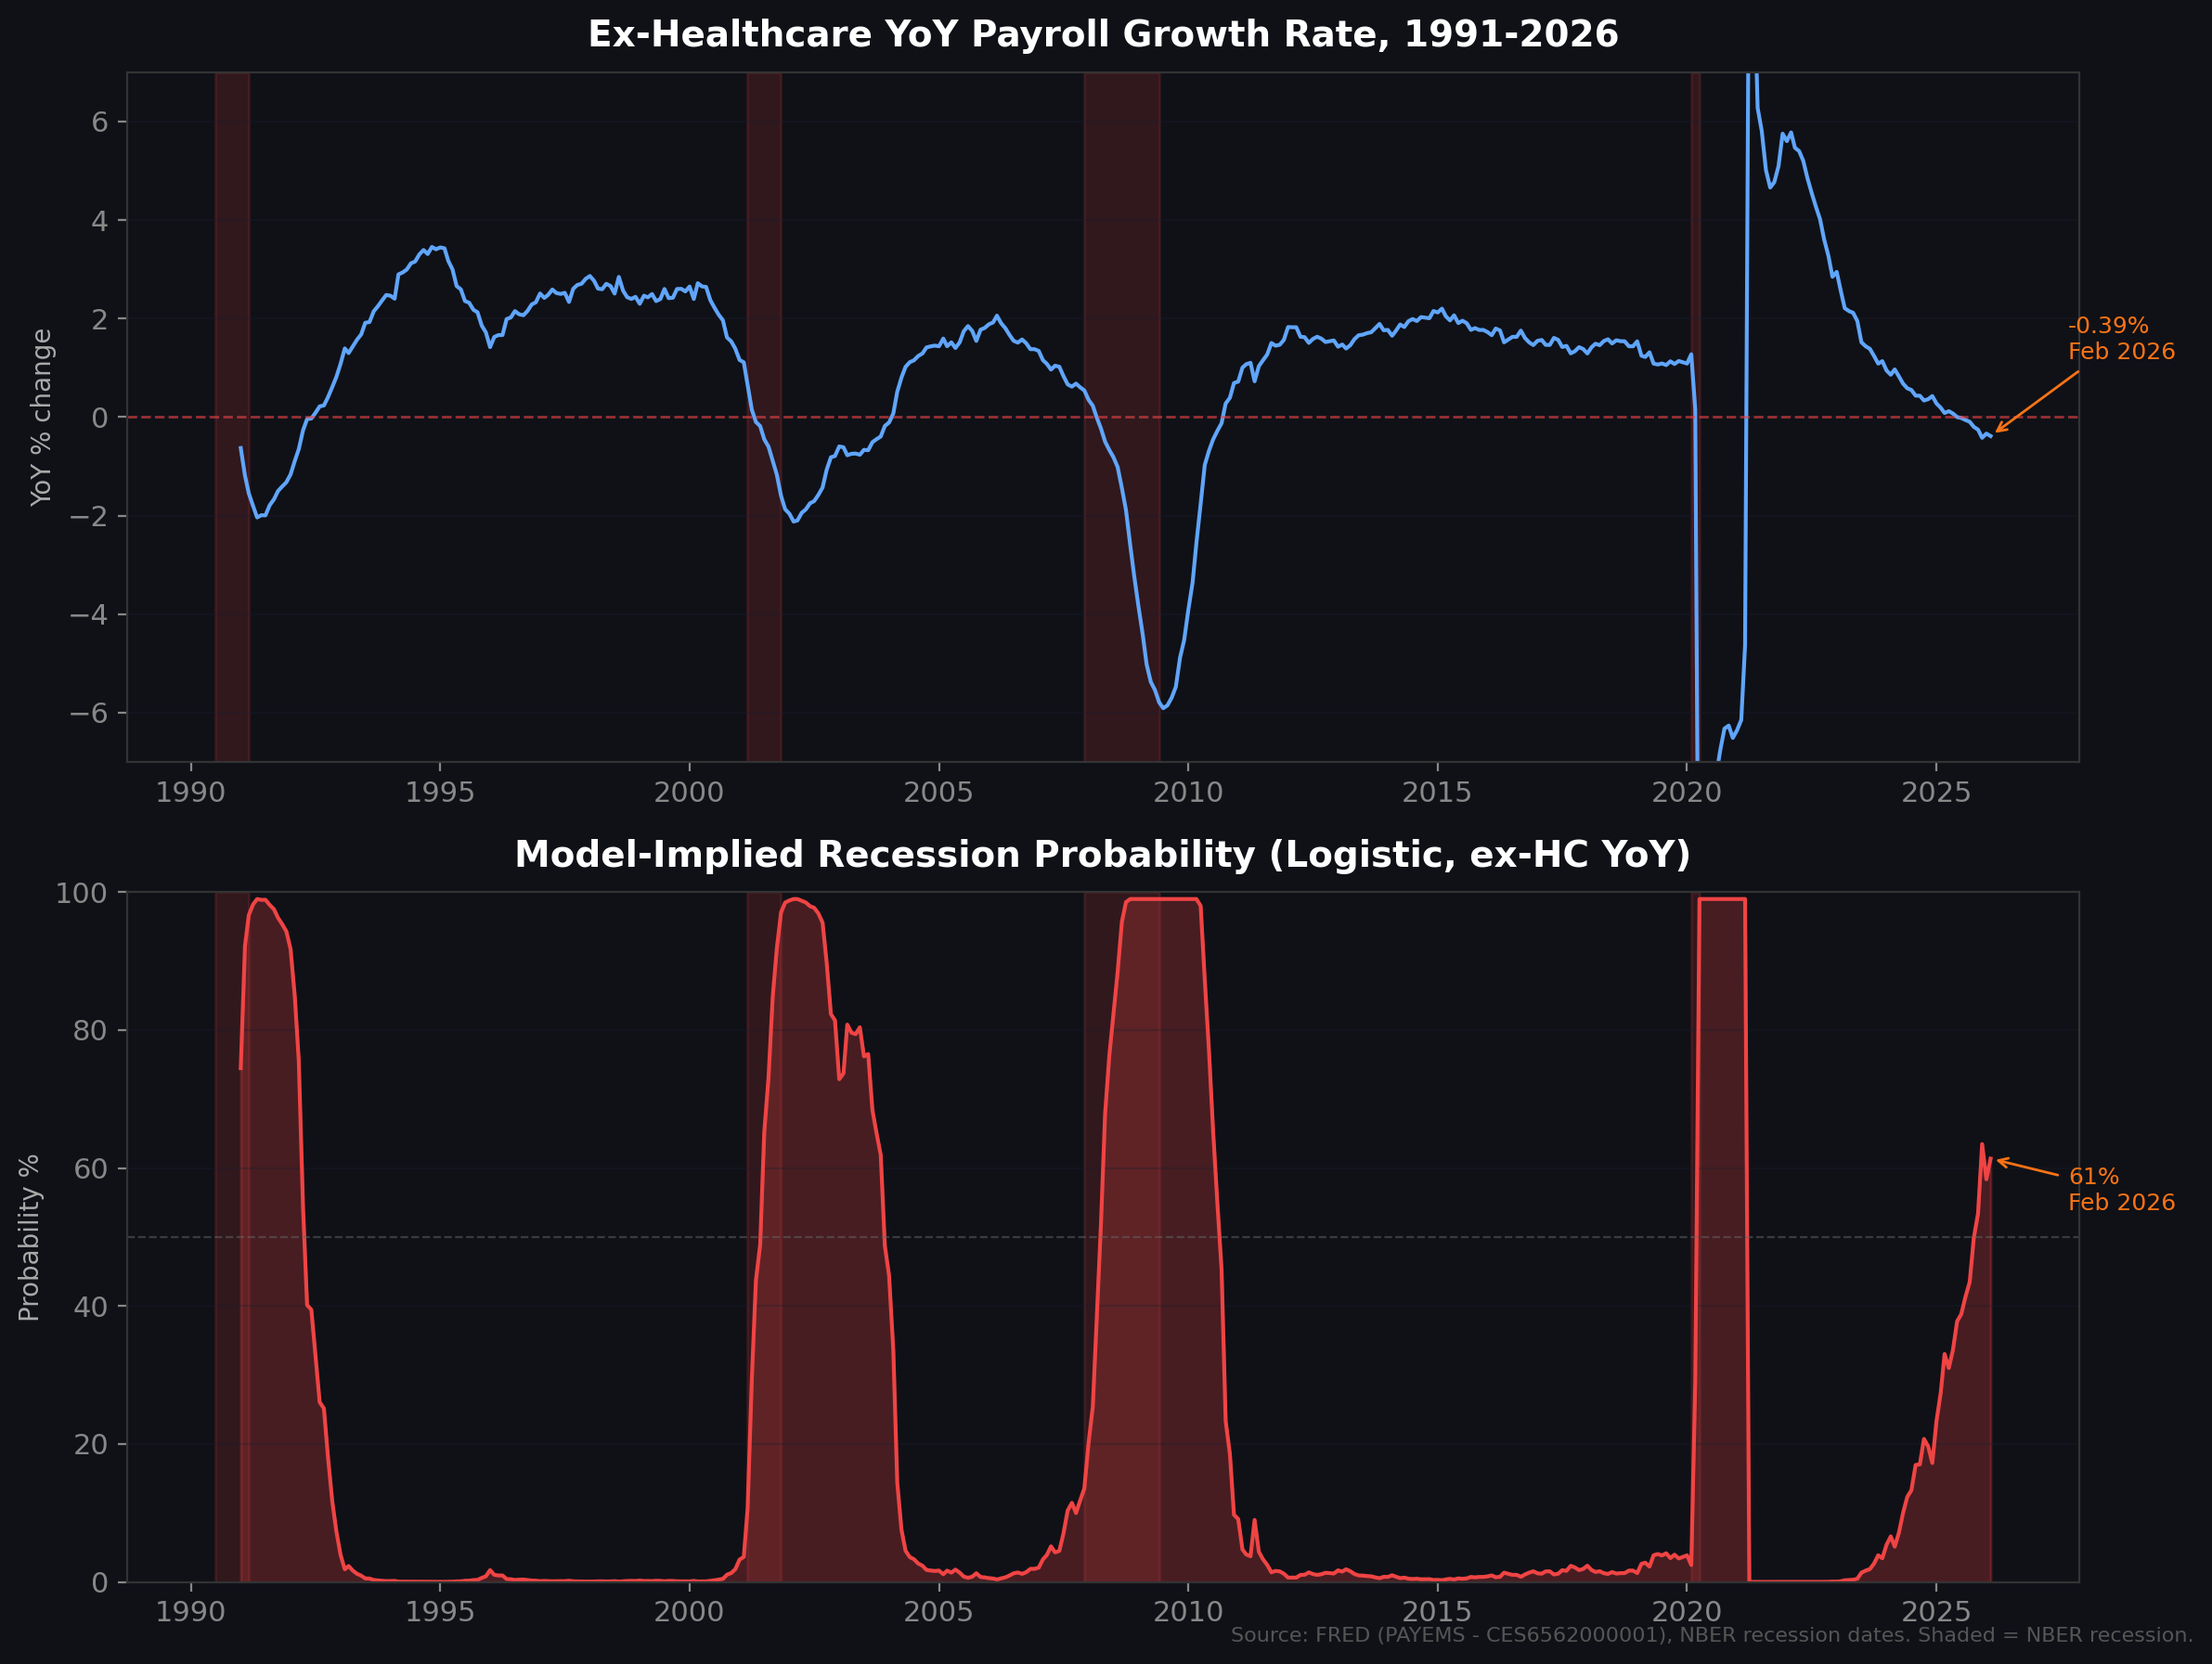
In every prior cycle (1990-91, 2001, 2007-09), labor market deterioration was fast. There was a precipitating event, firms cut headcount within months, and the standard recession indicators fired in sequence. In 2001, ex-healthcare year-over-year growth went from +1.16% in January to -0.45% in July, a 161-basis-point decline in six months. In 2008: +0.35% in January to -1.89% in October, a 224-basis-point decline in eight months.
This cycle does not follow that pattern. The ex-healthcare growth rate has been declining since peaking at +0.97% in March 2024. It took fifteen months to cross zero. As Employ America documented, this gradual rise in unemployment is “virtually unprecedented in the post-war history of the U.S. labor market, which is dominated by quick deteriorations followed by gradual recoveries.”
The standard indicators are calibrated for the fast version. The NY Fed recession probability model reads 18.78%. The Sahm Rule reads 0.30, below its 0.50 trigger. Initial claims are at 213,000. The yield curve has un-inverted.
The indicators designed for gradual deterioration show more. The Conference Board LEI has declined for five consecutive months. Long-term unemployment has risen to 25.7% of all unemployed, a level the Minneapolis Fed noted is typically associated with recessionary conditions.
The Peterson Institute quantified the disconnect: the November 2025 hires rate of 3.2% would historically have accompanied an unemployment rate of around 8%. Actual unemployment was 4.5%. The San Francisco Fed formalized this as a “tandem slowdown” in labor supply and demand: job growth slowed to a near halt in 2025, but unemployment rose only modestly because labor force participation was falling too.
This is a hiring problem. Layoffs remain low. Firms are not aggressively cutting headcount, nor are they replacing workers who leave. The increase in unemployment is disproportionately driven by new entrants and re-entrants who cannot find work.
We built a logistic regression framework keyed to year-over-year payroll growth (both total nonfarm and ex-healthcare), fit to NBER recession dates back to 1990. The model-implied probability has risen from roughly 12% in early 2024 to 61% today, in a steady two-year climb rather than the spikes that preceded prior recessions.
Growth without jobs
Output remains positive while employment contracts. ISM Services was 56.1 in February, the highest reading since July 2022. GDPNow estimates Q1 2026 at 2.1%. Industrial production posted a +0.7% January gain. Goldman Sachs’ Jan Hatzius has framed this as “Sturdy Growth, Stagnant Jobs, Stable Prices”, treating weak employment as a feature of rising productivity rather than a recession signal. As Axios reported, both the administration and the Fed expect a productivity boom to enable continued GDP growth without a commensurate increase in employment.
In 2002, that happened. Productivity growth of roughly 3% enabled GDP expansion while employers shed 400,000 jobs, and the Fed cut aggressively because inflation was low.
Today, core PCE is at 3.0%. ISM manufacturing prices paid rose to 70.5 from 59.0, the highest since June 2022, on tariff-related cost increases in steel, aluminum, and raw materials. On February 28, the Iran war began.
None of the bank recession estimates (Goldman at 20%, J.P. Morgan at ~35%, the NY Fed DSGE model at 0.6% GDP growth for 2026) incorporate the oil shock. Brent and WTI both spiked to $119 on Monday before retreating to the low $90s on Tuesday as the administration signaled a potential early exit from the conflict. Even after the pullback, crude remains roughly 40% above pre-conflict levels. U.S. crude posted its biggest weekly gain in futures trading history last week. If the conflict re-escalates, Qatar’s energy minister has warned that prices could reach $150 if tankers remain unable to transit the Strait of Hormuz.
March’s report will reverse the Kaiser strike, mechanically adding roughly 31,000 jobs. The test is what the rest of the economy does in a clean month. Nonfarm payrolls ex-healthcare peaked fourteen months ago, and no sector has emerged to replace the jobs that are disappearing. Healthcare remains the exception, but its role as the economy’s sole engine of job creation raises its own set of questions: how long can a supply-constrained sector sustain this pace, what happens to the labor market narrative when even healthcare hiring decelerates, and what does the sub-industry composition of healthcare employment reveal about where the economy is actually headed? That will be the subject of a forthcoming post.